Chapter 2: Human Neuroanatomical Evolution
There are several sources of information that allow us to reconstruct a general outline of human brain evolution. We are guided both by a comparative perspective as well as by an analysis of the fossil record ('paleoneurology'). The most obvious evolutionary change was in overall size, but it is likely that other changes also played an important role. There is a great deal of debate over the relative contribution of structural changes and size increases in the evolution of human behavior, as I will outline below. There is also evidence of changes in the relative proportions of various components, e.g., in the amount of grey vs. white matter in the cortex. Furthermore, not all functional units in the human brain evolved at the same rate. That is, the human brain is not a simple scaled-up version of an ape brain, and this will give us important clues to the possible causes of the evolution of human behavior.[1]
2.1 Overall Brain Size
An estimate of the change in overall size of the hominid brain can be derived from two sources, both of which converge on the same answer. Modern human brain size averages about 1400 cc (Jerison 1973; Holloway 1980; Pakkenberg 1964; Tobias 1971; Dekaban 1978; Beals 1984). By contrast, our closest living relatives have much smaller brain sizes: Modern chimpanzees and orangutans have brains averaging about 400 cc, with gorillas averaging about 500 cc (Tobias 1971, see appendix A table 3). Humans, chimpanzees, and gorillas last shared a common ancestor between four and six million years ago, and this group shares a common ancestor with the orangutan at about 10 million years ago (Sarich 1971; Sibley and Ahlquist 1984). We also know that the oldest hominid species for which brain size has been estimated, Australopithecus afarensis (dating to between 2.9 and 3.2 MYA), had a brain size of ~400 cc (Holloway 1983b; see appendix A table 1). This suggests that the common ancestor of humans, chimpanzees and gorillas had a brain size of somewhere close to 400 cc.
The increase in brain size in hominids appears to have begun at least by the time of Homo habilis, around 2 MYA (figure 2.1). TheHomo habilis specimen KNM-ER 1470, which is dated to ~1.8 MYA, has a brain size estimated to be 752 cc (Holloway 1983b). As figure 2.1 indicates, absolute brain size increased fairly steadily from this point on.
2.1.1 Brain Size Scaling
The preceding discussion has ignored the possible confounding influence of body weight. It has long been clear that brain size varies in a predictable way across species in relation to body weight, though not in a simple isometric manner. A number of species have brain sizes larger than humans in absolute terms. Humpback whale (Megaptera nodosa) brains, for example, weigh between 5000 and 7000 grams, and elephant (Loxodonta africana) brains average about 5700 grams (Quiring 1950). In relative terms, if we calculate brain size as a simple percentage of body weight, a number of small mammals would rank higher than humans. Our brains constitute between 1.6 to 3.0 percent of our body weight, but the brains of mice in the genus Zapus constitute between 3.4 to 3.6 percent of their body weights (Cartmill

Figure 2.1: Cranial capacity in fossil hominids over time, compared to extant chimpanzees (Pan troglodytes ) and humans (Homo sapiens sapiens ). Horizontal bars reflect uncertainties in dating. Vertical bars indicate ranges in cranial capacity for given taxonomic groupings (data points without vertical bars indicate single specimens). Data compiled by Falk 1987a, with minor changes (see Appendix A table 1).
1990). When we graph log-transformed body size against log-transformed brain size for a large number of mammals, a strong, obvious allometric relationship can be seen.[2] Figure 2.2 shows the brain and body sizes extracted from the literature for a set of 95 mammal and one reptile species ranging from Zapus hudsonicus (jumping mouse), weighing just over 17 grams, to Balaenoptera musculus (blue whale), weighing more than 58,000,000 grams (see appendix A, table 2 for data and sources). This relationship is quite strong across the vast range of mammalian brain and body sizes (the correlation is typically greater than r= 0.95), and this empirical fact allows us to compare different species by how far above or below this allometric line they lie. This is known in the literature as "relative brain size." A species' "encephalization quotient" (EQ) is a measure of relative brain size; it indicates how much larger a species brain is than would be expected based on the general relationship found in other species (Jerison 1973). It is calculated as the ratio of actual brain size to brain size predicted on the basis of the species body weight. Almost all primates lie above the mammalian line (and therefore have EQ's greater than 1), with humans displaying the greatest EQ's. The closest species to humans in this regard are not other primates but cetaceans (e.g., various dolphin species and false killer whales: see figure 2.2 and appendix A, table 2).
It is also important to note, however, that there is actually quite a large range in brain sizes for a given body weight, even though the overall relationship is very strong. The interval encompassing 95% of the species (those within two RMS errors of the regression line)[3] in figure 2.2 spans a

Figure 2.2: General relationship of body to brain size in mammals. Based on a diverse set of 95 mammals (of which 52 are primates) from 12 orders. One reptile (alligator) is shown for comparison. The line represents the best-fit major-axis slope for a larger sample of 309 mammalian species: Brain=11.22(Body)0.76 (r =0.96, Martin 1981; brain weight in grams, body weight in kg). The reduced major axis slope for only the data in the graph (excluding alligator) is 0.72 (r =0.96). The black squares are hominoids, gray squares are cercopithecoids (old world monkeys), white squares are ceboids (new world monkeys), gray diamonds are prosimians, white diamonds are other non-primate mammals. See Appendix A, table 2, for the data used in this graph and their sources.
range covering a 15.5-fold difference in brain size at a given body size (the root mean square error for log transformed data from Figure 2 is ~.30; four RMS errors span 1.19 on log coordinates; 101.19= a 15.5 fold difference, on average, from smallest to largest at a given body size). This does not mean that at every body size, one can find species that differ by this much, but it does mean that a substantial amount of brain size variation is not explained by body size alone. The data in figure 2.2 contain numerous specific examples of species close in body weight that differ by more than 3-fold in brain size. As extreme examples, Schmidt's guenons (Cercopithecus ascanius) have body weights almost identical to armadillos (Dasypus novemcinctus), yet have brains that are 8.5 times as large. Humans and warthogs (Phacochoerus aethiopicus) differ by less than 1 kg in body weight but differ more than 11-fold in brain weight. False killer whales (Pseudorca crassidens) reportedly weigh almost 300 kg less than African buffalo (Syncerus caffer), yet have brains that weigh 7.9 times as much. False killer whales also weigh only 36 kg more than manatees (Trichechus manatus), yet have brain sizes 12.7 times larger (see figure 2.2 and appendix A, table 2, for details and references on all these species). Thus, we should keep in mind that the brain/body size relationship is not a deterministic one.
EQ's are dependent on the empirically derived relationship between brain size and behavior, which in turn is dependent on the specific set of species that are used to derive the regression line. The slope of a best-fitting major-axis line drawn for 309 mammalian species is about 0.76 (Martin 1981). Harvey and Krebs (1990) report a slightly lower slope of about 0.69 if the method of independent contrasts is used (controlling for phylogenetic non-independence of data points).[4] Jerison (1973) used a smaller data set and obtained a value of close to 0.66.
The slope also varies somewhat depending upon the taxonomic level which is used to make the estimate, with lower taxonomic groupings sometimes showing shallower slopes (Pagel and Harvey 1989). This has been called the "taxon-level effect" (Martin and Harvey 1985). Empirically, the slope derived from mean brain and body sizes for different mammalian orders is ~0.75, but slopes derived for mean brain and body sizes for different species within a given genus tend to be lower (though not always; Pagel and Harvey 1989). Average brain and body weights for different breeds of dogs (which are not different species, but are obviously very different genetically at some level) scale at a slope of 0.27 (Bronson 1979). Within species correlations between these variables are typically either zero or very low (Martin and Harvey 1985).
2.1.1.1 Causal Explanations of Brain to Body Size Scaling
The causal explanation for the relationship between brain and body size is a matter of great debate. Because Jerison's (1973) set of data suggested a slope of ~0.66, he argued that brain size was keeping pace with surface area (which increases at the 2/3 power of body size). The idea was that because the brain is connected via sensory inputs to the external surface of the body, brain size would only need to keep up with this increase, not overall body size. However, Fox and Wilczynski (1986) showed that the cross sectional area of the spinal cord (presumably a reasonable proxy for the total number of somatic afferent and efferent connections between the brain and the rest of the body) scales with body size at a slope of ~0.34 in a sample of rodents. Hofman (1982) came to a similar value for mammals as a whole. If any dimension of the brain should scale at a slope of 0.66 (to match increasing body surface area), this measure should. This calls into question at least a simple version of the body surface area scaling argument (Deacon 1990a).
Martin (1981) argued that since the actual slope across mammals appears to be closer to 0.76, a causal connection with basal metabolism is implied because basal metabolism increases at the 3/4 power of body size across mammals (see also Armstrong 1983). The idea is that brain growth is constrained by the total metabolic resources of the mother's body during gestation (Martin 1981). Jerison (1988) points out that it might be surface area of the brain, and not brain size per se, that is scaling with surface area of the body. Since cortical depth increases at the ~.17 power of brain size, the actual expected slope would be .66 + .17(.66) = ~.78. Thus, many models are consistent with a given estimated slope, which makes it difficult to use slope alone as evidence for one over another model (Deacon 1990a), though clearly some models are ruled out by a slope of .76 versus .67.
Deacon (1990c) notes that there is an asymmetry in response to selection for brain compared to body size. Roderick et al. (1976) performed selection experiments in mice and found that selection (over 16 generations) for brain size caused a correlated change in body size, with a slope of about 0.73.[5] Selection on brain size was accomplished in the following manner: A series of mated pairs were sacrificed after each pair had produced one or more litters. Brain weights were then measured in each pair, and only the offspring of the pair with the highest (or lowest) average brain size were allowed to reproduce in the next generation. The slope of ~0.73 agrees closely with the experimentally derived slope for all mammals as discussed above, and supports the hypothesis of a metabolic constraint of some kind on brain size. However, selection for body weight apparently causes little change in brain weight (Atchley 1984, Riska et al. 1984). Thus, while increases in brain size in some sense allow for body size increases, increases in body size do not necessitate increases in brain size. This is consistent with the idea that larger brains in some sense require (or select for) larger bodies because of the increased metabolic demands these larger brains place on organisms. Conversely, body size increases may simply "pay for themselves" metabolically. In addition, larger body size, because of concomitant increases in strength and so forth, might actually lessen the need for greater brain size in a species, thereby selecting for smaller brain size than one might otherwise predict (this assumes there is some sort of behavioral benefit to increasing brain size).
Pagel and Harvey (1988) challenged the metabolic hypothesis by showing that species with greater metabolic rate do not tend to have larger brained offspring if one controls for differences in body weight. Larger brained species do, however, have longer gestation periods, and they suggest that bigger brain sizes are achieved simply by prolonging gestation. However, this does not prove that metabolic rate is irrelevant, simply that it does not act independently of body weight. That is, metabolism and body weight might be so intimately connected that little meaningful metabolic variance is left after statistically removing the variance that is correlated with body size. And of course, variation in the length of gestation does not explain why the slope of the brain-to-body relationship in mammals is close to 0.76.
McNab and Eisenberg (1989) also argue that the metabolism hypothesis is not valid because controlling for body weight differences eliminates the brain-metabolism association. However, this is an incorrect inference. What we are interested in explaining here is the scaling coefficient between brain size and body weight. As was pointed out in the previous section, there is a significant amount of brain size variation that is not explained by body size. By regressing out the variability in brain size that is specifically associated with body size, McNab and Eisenberg (1989) are removing exactly that variance in brain size that the metabolism hypothesis is trying to explain. Thus, while they have shown that variance in brain size that is independent of body size is not associated with variance in metabolism that is independent of body size, this cannot serve as evidence against the hypothesis that metabolism plays a role in the brain-body scaling relationship, because their analysis focusses on that portion of the brain size (and metabolism) variance that is irrelevant to the scaling question that is at issue. Furthermore, McNab and Eisenberg (1989) note that 95% of the variation in both log brain size and log basal metabolism is explained by body size variation across mammals. Thus, their entire analysis is based on only 5% of the variance. It seems likely that metabolic rate is relevant to the brain-body relationship across mammals, even if not in as direct a manner as Martin (1981) and Armstrong (1983) originally suggested.
Deacon (1990b) argues that the emphasis on adult brain-body scaling relationships is misplaced, and that instead we should focus our attention on ontogenetic processes. Specifically, he points out that brain growth in mammals occurs in two distinct phases. In the first phase brain growth is isometric with body growth, following a slope of ~1 between brain and body size. During this phase, both brain (specifically neural and glial cells) and somatic cells undergo mitotic growth simultaneously. In the second phase brain growth (neural and glial mitosis) tapers off dramatically while body growth (somatic mitosis) continues, resulting in a much lower slope of relationship, in some cases becoming zero or even negative (Martin and Harvey 1985, Kruska 1987). The interspecific slope is, according to Deacon, an artifact of the close similarity in the relative length of time each species spends in these two growth phases. Some groups of species (i.e., primates, dolphins, and elephants) follow the same pattern with respect to the length of time spent in each growth phase (and the trajectory of each phase remains the same), but they differ by having the whole growth curve shifted up. At each ontogenetic stage they have roughly twice the brain mass for a given body weight than is found in other mammals (Count 1947, Sacher and Staffeldt 1974, Sacher 1982, Martin 1983).
Note, however, that Deacon's explanation is really not an explanation at all. It merely describes how the interspecific adult brain/body relationship develops ontogenetically, and says nothing whatsoever about why the two growth curves should happen to maintain the same relative relationship across broad groups of mammals. Deacon's focus on ontogenetics simply displaces the basic evolutionary question, it doesn't answer it. His own suggestion is that the brain/body relationship reflects the constraints of an ancient "bauplan,"[6] highly conserved over vertebrate evolutionary history, but this is not really an explanation either. Cain (1964) and others (e.g., Dawkins 1982) have pointed out that such cases of "phylogenetic inertia" are in fact evidence of natural selection at work. Any feature that is truly neutral with respect to natural selection will rapidly be degraded and eliminated by continuously occurring random mutations and genetic drift (Futuyma 1986). The fact that significant variation exists with respect to brain/body relationships, as pointed out above (and by Deacon 1990b), makes the idea of a "bauplan" questionable. Thus, the question becomes: "what is adaptive about the specific ratio of the two growth curves that maintain the mammalian brain/body relationship?" which brings us back to the same basic question we started with.
The finding that the slope of the relationship between brain and body size differs with the taxonomic level of analysis (the "taxon-level effect") also has a number of potential explanations. All of them share the idea that different explanations can apply at different levels of the analysis. Lande (1979) suggests that change among closely related species might be due to selection on body weight (which experimentally produces only a small change in brain size, as pointed out above), whereas more distant species comparisons include a larger number of cases in which there was selection for brain size differences as well (which experimentally produces a relatively larger change in body size).
Deacon (1990b) makes a similar argument, though he believes selection for body size alone can explain both the lower slopes at lower taxonomic levels as well as the overall mammalian relationship. In keeping with his emphasis on the ontogenetic growth curves, he suggests that changes among closely related species may have a greater tendency to occur in the second growth phase (with the low slope relating brain and body weights). Changes over longer evolutionary periods (and consequently encompassing broader sets of species) might also reflect selection on body size. Since changes at earlier embryonic stages are more likely to be buffered from external forces than changes in the second growth phase, he suggests these longer term trends would be dominated by changes in the earlier growth phase. These early changes would affect brain development, which in turn would (through brain mediated hormonal systems) affect body size. Thus, direct selection for brain size is not part of his model, and although he does acknowledge that selection for brain size has occurred (e.g., in primates and cetaceans), he argues that we should "...rule it out as a primary factor determining mammalian allometric trends." (Deacon 1990b, p. 254). However, the idea that such an expensive and complicated organ (see chapter 3) has primarily served as a means to determine body size in mammals seems intuitively unlikely.
By contrast, Pagel and Harvey (1989) suggest that selection directly on brain size has occurred. Their explanation of the taxon-level effect is that species which are taxonomically further removed are more likely to inhabit different ecological zones, and thus are more likely to have undergone selection for relatively larger or smaller brain size for a given body weight. Thus, a few unique species (with respect to encephalization) might be causing the taxon-level effect (Pagel and Harvey, 1989, present data consistent with this hypothesis).
Another explanation is that the effect is due to a simple restriction of range of body weight that occurs whenever one looks at lower taxonomic levels. As demonstrated in figure 2.2 above, mammals display an immense range in body weight. Any given subgroup of mammals will necessarily have less variability than mammals as a whole, and this restriction of range is quite likely to have an effect on the size of the slope. In the extreme example of range restriction where only variability within a single species is analyzed, this effect should be most pronounced. However, the extent to which this general principle explains the taxon-level effect has not been addressed so far in the literature.
The explanations for the exact value of the slope in mammals (and of such phenomenon as the taxon-level effect) are interesting and important questions in and of themselves. However, in order to understand the fundamental features of hominid neuroanatomical evolution, answers to these questions are not required, as will become clear in the next section. The magnitude of the change in hominid brain size is so large that conclusions about the importance of body size are not meaningfully affected by the exact slope for mammals (or primates alone, for that matter).
2.1.1.2 Encephalization in Hominid Evolution
Given that brain size and body size are closely related across mammals (as shown in figure 2.2) we can estimate the relative size of the difference between humans and the species closest to us in a number of ways. Table 2.1 compares average body weight and brain weight estimates for male and female human, chimpanzee (Pan troglodytes ) gorilla (Gorilla gorilla ), and orangutan (Pongo pygmaeus ). It also includes estimates of the relative (EQ's) and absolute ('extra mass') amount of neural tissue of these species in relation to the average mammal of their body weights. Clearly, body size in no way explains the huge difference in brain size between humans and pongids, and it isn't even necessary to calculate EQ's to see this. For example, the average male gorilla weighs ~2.3 times as much as the average male human, yet humans have brains that are ~2.6 times larger.
Table 2.1: Comparison of brain sizes between the great apes and humans, controlling for body weighta
|
Species |
sex |
body (kg) |
brain (g) |
EQb |
Extra massc |
||||
|
Homo sapiens |
M |
72.9 |
1463 |
5.00 |
1170.35 |
|
|||
|
|
F |
59.6 |
1294 |
5.16 |
1043.44 |
|
|||
|
|
|
|
|
|
|
|
|||
|
Pan troglodytes |
M |
60.0 |
413 |
1.64 |
160.85 |
|
|||
|
(chimpanzee) |
F |
47.4 |
384 |
1.82 |
173.69 |
|
|||
|
|
|
|
|
|
|
|
|||
|
Gorilla gorilla |
M |
169.5 |
554 |
1.00 |
-1.00 |
|
|||
|
(gorilla) |
F |
71.5 |
472 |
1.83 |
184.08 |
|
|||
|
|
|
|
|
|
|
|
|||
|
Pongo pygmaeus |
M |
87.7 |
450 |
1.34 |
113.77 |
|
|||
|
(orangutan) |
F |
37.8 |
388 |
2.19 |
210.61 |
|
|||
aSee Appendix A, Table 3 for sources.
EQ = (brain size) / (11.22(body size)0.76 ) (brain in grams, body in kg)
Extra mass = (brain size) Ð (11.22(body size)0.76 (brain in grams, body in kg)
The estimates in table 2.1 of the absolute amount of extra neural tissue ('extra mass') show an even greater difference between extant humans and pongids. Whereas the human EQ's are ~3.1 times larger than the average across pongids, human 'extra mass' estimates are ~7.9 times larger than the average across pongids. Note also that, because of the logarithmic nature of brain <-> body relationships, large animals with the same relative brain size (EQ) as small animals will still have much greater amounts of extra neural tissue in absolute terms. A number of researchers have suggested that absolute size differences might be more indicative of behavioral differences than EQ's (e.g., Rensch 1956). While it is of course not inherently necessary for the absolute amount of excess neural tissue to be a more important behavioral indicator than relative amounts of excess tissue, it does seem more plausible if we take an information processing perspective (i.e., a sort of computer chip analogy).
The dramatic increase in brain size in hominids, taking body size changes into account, is graphically illustrated in figure 2.3, which plots estimated brain and body sizes for various hominid species for which we have the requisite data. For comparison, mean data for extant humans and pongids are also plotted, along with the best-fit line of general relationship for mammals (following Martin 1981). The fossil data contain an unknown amount of error due to small sample sizes and incomplete representation of different portions of the skeleton for which to estimate body size.[7] Nevertheless, the trend away from the general mammalian relationship for

Figure 2.3: The relationship between cranial capacity and body size in fossil hominids. For comparison, mean values for male and female pongids and modern humans are also included (squares: extant humans (Homo sapiens ); triangles: orangutan (Pongo pygmaeus ); diamonds: chimpanzee (Pan troglodytes ); circles: gorilla (Gorilla gorilla ); for all species, females have smaller body weights and smaller cranial capacities). Hominid body weights were estimated by extrapolation from best fit lines relating body weight to some portion of the skeleton (usually lower limb joint sizes, and/or femur lengths). Boxes for early hominids (australopithecines and Homo habilis ) defined by: 1) average female and average male estimated body weights, 2) known range in cranial capacities (disregarding sex). Boxes for later hominids defined by : 1) range in estimated body weight, 2) known range in cranial capacities. Line for mammals is from Martin (1981) (see notes to Figure 2). See Appendix A, table 3, for data and sources.
hominids is unmistakable and remarkably consistent. There is a trend toward larger overall body size in later hominids, but the increase in brain size is even greater. Also clear on this chart is that although brain sizes in modern pongids lie above the general mammalian line (except for male gorilla), they do not lie nearly as far above this line as do hominids. Holloway (1981a) has calculated (with earlier body size estimates from McHenry 1975) that even the earliest australopithecines (which are the earliest hominids) demonstrate relative increases in brain size over that shown by extant pongids.
2.2 Grade Differences in Primate Brain Size
A significant dimension of primate brain size variability occurs not simply with respect to body size, but also with different grades of primate. There are four major primate grades that are generally recognized: prosimians, monkeys, apes, and human. Even after controlling for body size differences, brain size in prosimians is almost half as large as it is in monkeys. For the 18 prosimians in figure 2.2, the average EQ is 1.2, while the average for the 27 monkeys (cercopithecoids and ceboids) is 2.0 (see appendix A, table 2). Furthermore, the 15 heaviest prosimians overlap very closely in body weight with the 15 lightest monkeys. In comparing these two groups, we find that even though these heavy prosimians average slightly more in body weight than the lighter monkeys (1.6 kg versus 1.4 kg), the prosimians have an average brain size of only 15.8 g while the monkeys average 33.5 g.
By contrast, monkeys do not differ substantially from apes in relative brain size. The average EQ among the 6 apes (excluding humans) in figure 2.2 is 1.8 (and only 1.5 if we exclude the lesser apes, the gibbons: genus Hylobates). This means that ape brain sizes are about as far above the line of brain/body relationship for mammals as monkeys are. In fact, the brain/body relationship derived from monkey data (23 monkey species in Stephan et al. 1981) predicts the Pan, Gorilla and Pongo brain sizes remarkably well. Pan brain sizes are only 1.14 times as large as expected for a monkey with the same body weight, while Pongo brains are only 1.08 times as large and Gorilla brains are only .83 times as large. By comparison, we may note that the talapoin monkey (Cercopithecus talapoin) has a brain size 1.58 times as large as expected for a monkey of its body weight. Thus the apes do not represent a grade shift with respect to relative brain size, even if we use monkey data to predict their brain sizes. However, there is a substantial difference in absolute body weight between the great apes (Gorilla, Pan, and Pongo) and monkeys, and this may well be the crucial variable with respect to behavior (as discussed briefly above). The smallest great ape in figure 2.2, the common chimpanzee (Pan troglodytes), weighs about 54 kg and has a 399 g brain. The largest monkey in figure 2.2, the olive baboon (Papio anubis) weighs 25 kg and has a 191 gram brain. The gibbons in figure 2.2 average 5.7 kg in overall body size and 92 grams in brain weight, which falls within the range found for monkeys of similar body weight.
As shown in the previous section, there is no overlap, either in relative or absolute terms, between humans and apes (or any other primate). Thus there are at least three major grades of brain size in primates, and four if we consider absolute brain size to be the crucial variable.
2.3 Other Aspects of Brain Evolution
Although the overall increase in size of the brain was the most conspicuous change that occurred during hominid evolution, the human brain is more than just a scaled-up version of a generalized primate brain. Different subcomponents of the brain have changed to different extents, and an analysis of these differences will likely give us clues about the natural history of the human brain. In this section I will outline what is known about the relative changes in different neuroanatomical areas. Current understanding of the functional organization of the brain will be presented later, and will allow us to make some informed hypotheses that might explain the uneven rate of growth.
There are different ways in which various regions of the brain could vary, and it is profitable to distinguish relative size differences (using brain size as the scaling factor) from absolute size differences. Certain areas might represent roughly the same proportion of brain tissue as homologous areas in other species' brains, but could still be absolutely much larger (as well as being larger after controlling for body size differences). Other areas might be proportionately smaller in humans given the size of our brains. Still other areas might be larger both in relative and in absolute terms. Passingham (1975), Deacon (1984, 1988), and others have summarized the comparative data relevant to these questions.
2.3.1 Major Neuroanatomical Divisions
Using data from Stephan et al. (1970), Passingham (1975) calculated that the neocortex in humans shows the largest increase over that predicted by body weight in primates, followed closely by the cerebellum. The neocortex is 3.2 times larger than predicted for primates of our body weight, and the cerebellum 2.8 times larger. Other major subdivisions were lower, though still substantially higher than predicted by body weight. In his data set, only the medulla failed to show any increase over that predicted by body weight, which is consistent with its functional importance to the basic autonomic functions of the body (e.g., respiration, heart rate, etc.).
However, it is important to keep in mind that the brain is slightly more than 3 times larger overall than predicted for primates of our body weight (see table 2.2 below), which means that subcomponents scaling lower than this are actually not keeping pace with the overall increase in brain size, even though all of them (except the medulla) are bigger in relation to overall body weight. Passingham (1975) showed that the neocortex is not much larger than expected for a primate with a human sized brain (based on data in Stephan et al. 1970). However, the remaining major subdivisions do not show the same pattern. Deacon (1984, 1988) calculated that the medulla is much smaller than primate trends would predict for a brain of human size, as is the case for the diencephalon, cerebellum, and mesencephalon (based on data in Stephan et al. 1981). Deacon (1988) points out that these findings are superficially contradictory, in that one portion of the brain cannot be scaling appropriately while all others are scaling smaller than predicted. Part of the explanation is that the neocortex is by far the largest portion of the brain, accounting for more than 80% of total brain weight in humans (see table 2.2 below). A relatively small increase in the size of the neocortex over that predicted for primate brains would offset the relative decreases found in other areas.
Table 2.2 contains encephalization quotients (EQ's) based on body size scaling parameters for a number of different neuroanatomical components. These were calculated using the non-human anthropoid data in Stephan et al. (1981) which includes 26 different species. These EQ's indicate how much larger or smaller different neuroanatomical components are as compared to the expected size for a non-human anthropoid primate of the same body
Table 2.2: Encephalization quotients of different neuroanatomical components based on non-human anthropoid primate trends with respect to body weighta
|
Neuroanatomical componentb |
Homo sapiens |
Pan troglodytes |
Gorilla gorilla |
overall brain 3.08 1.20 .83
telencephalon (84.9%) 3.21 1.21 .79
neocortex (80.4%) 3.30 1.23 .78
striatum (2.3%) 1.87 1.00 .69
hippocampus (.8%) 1.94 .87 .69
lobus piriformis (.7%) 2.38 .87 1.00
schizocortex (.5%) 2.24 .92 .73
septum (.2%) 2.72 1.07 .94
striate cortex (1.8%) 1.05 1.05 .78
bulbus olfactorius (.01%) .63 1.64 1.41
diencephalon (2.7%) 1.83 1.05 .80
thalamus (1.5%) 1.88 1.01 .82
hypothalamus (.3%) 1.94 1.13 .95
epithalamus (.01%) 1.59 .76 1.00
sub-thalamus (.4%) 1.88 .95 .74
lateral geniculate body (.03%) 1.44 1.10 .75
cerebellum (11.0%) 2.88 1.18 1.02
mesencephalon (.6%) 1.97 1.07 .84
medulla (.8%) 1.32 .96 .79
ventricles (1.5%) 6.55 .83 .92
aThese numbers indicate how much larger or smaller a given component is, in the species listed, given non-human anthropoid primate trends for each component with respect to body weight. They are calculated as the ratio: (actual size of the component for each species)/(predicted size based on primate trends for that component given the species body weight). Prediction equations were derived independently for each component via least-squares regression on log-transformed data. Equations were calculated with non-human anthropoid primate data from Stephan et al. (1981) (N= 26, except for epithalamus, thalamus, hypothalamus, and sub-thalamus for which N= 14). Note that the components listed are not always mutually exclusive portions of the brain (e.g., the neocortex is a major component of the telencephalon, which in turn is a major component of overall brain size.)
weight. These findings are essentially the same as those of Deacon (1984, 1988) and Passingham (1975). Of interest is that while all the components in Homo sapiens except the bulbus olfactorius (olfactory input) are larger than one would expect given a non-human primate of our body size, only a few of these (telencephalon, neocortex - a major component of the telencephalon, and ventricles - which are not brain tissues at all) have encephalization quotients as high as the overall brain. This indicates that these components must account for a greater proportion of the overall brain size increase in hominids.
This is confirmed in table 2.3, which shows EQ's calculated with respect to brain volume this time, instead of body weight. These tell us how much larger or smaller a particular component is as compared to the expected size for a non-human anthropoid primate brain of the same volume. As these calculations demonstrate, while the volume of the human telencephalon (and its largest component, the neocortex) is what we should expect given the volume of our brain, most other components are smaller. Clearly, most of the increase in the hominid brain can be attributed to portions of the telencephalon, most notably the neocortex, at the expense of other components. Another way to look at these relationships is to compare different (non-overlapping) neuroanatomical subcomponents across primates. For example, Deacon (1988) showed that humans have a much larger neocortex in relation to the size of our diencephalon than primate trends predict. The same is true if one compares all cortical structures to all subcortical structures. These analyses suggest that the hominid neocortex did in fact undergo disproportionate increases over our evolutionary history.
Table 2.3: Encephalization quotients of different neuroanatomical components based on non-human anthropoid primate trends with respect to brain volumea
|
Neuroanatomical componentb |
Homo sapiens |
Pan troglodytes |
Gorilla gorilla |
telencephalon (84.9%) 1.01 1.00 .96
neocortex (80.4%) 1.00 1.01 .95
striatum (2.3%) .65 .83 .82
hippocampus (.8%) .85 .78 .84
lobus piriformis (.7%) 1.06 .76 1.16
schizocortex (.5%) .85 .80 .90
septum (.2%) 1.18 .96 1.12
striate cortex (1.8%) .60 .94 .83
bulbus olfactorius (.01%) .31 1.47 1.59
diencephalon (2.7%) .70 .89 .94
thalamus (1.5%) .74 .88 .98
hypothalamus (.3%) .90 1.02 1.13
epithalamus (.01%) .73 .69 1.18
sub-thalamus (.4%) .64 .80 .87
lateral geniculate body (.03%) .49 .91 .85
cerebellum (11.0%) .92 .99 1.27
mesencephalon (.6%) .93 .95 .96
medulla (.8%) .58 .86 .95
ventricles (1.5%) 2.27 .69 1.09
aThese numbers indicate how much larger or smaller a given component is, in the species listed, given non-human anthropoid primate trends for each component with respect to brain volume. They are calculated as the ratio: (actual size of the component for each species)/(predicted size based on primate trends for that component given the species brain volume). Prediction equations were derived independently for each component via least-squares regression on log-transformed data. Equations were calculated with non-human anthropoid primate data from Stephan et al. (1981) (N= 26, except for epithalamus, thalamus, hypothalamus, and sub-thalamus for which N= 14). Note again that the components listed are not always mutually exclusive portions of the brain.
bNumbers in parentheses indicate the percentage of total human brain volume accounted for by these components.
Calculations for Pan troglodytes and Gorilla gorilla are included in tables 2.2 and 2.3 for comparison. The EQ values for Pan indicate that this species brain size is only about 20% above non-human anthropoid primate predictions given its body weight, with telencephalon (and specifically neocortex) accounting for most of this increase. The Pan and Gorilla EQ's with respect to brain size are generally larger for major subdivisions than they are in humans (e.g., hippocampus, striate cortex, diencephalon, cerebellum, mesencephalon, medulla, etc.) though they are generally still less than 1.00 (see table 2.3). This means these components are smaller than predicted for primate brains of their size, but not as small as one finds in humans. This suggests that the human pattern of expansion of the neocortex with respect to the rest of the brain may have begun prior to the hominid radiation. However, since brain size increase has occurred independently in most mammalian orders over the last 55 million years or so (as pointed out above; see Jerison 1973), we cannot unequivocally rule out the possibility that these aspects of chimpanzee brains are the result of parallel evolution. TheGorilla EQ's are generally low, probably due to the emphasis on body size increase that has clearly occurred in the gorilla lineage. This is consistent with the finding that the cerebellum (which plays a major role in muscle control and coordination) is larger than one would expect given the size of the Gorilla brain (table 2.3). It is important to keep in mind that these numbers indicate relative size changes, not absolute. Brain size in Gorilla, Pan , (and Pongo) are all significantly larger than those found in other primates in absolute terms. As pointed out above, it is not at all clear that absolute brain size is irrelevant to behavior. In this respect, the great apes represent an intermediate stage with respect to humans and other primates.
2.3.2 Cortical Areas
The cerebral cortex can be divided into primary sensory cortex (in which visual, auditory, gustatory, and somesthetic information is first processed cortically) and association cortex (which is not devoted exclusively to any primary sense, but rather to the integration of input from different sensory modalities). Overall, the expansion of the neocortex appears to be primarily due to expansion of association cortex, rather than primary sensory cortex (Passingham 1975). Of all the association areas, the pre-frontal cortex shows the greatest increases in humans, in both relative and absolute terms. This area of the human brain accounts for about 30% of the total neural tissue (Uylings and Van Eden 1990). Both Deacon (1984, 1988) and Passingham (1973) calculate (using data from Brodmann 1912) that the pre-frontal cortex in humans is slightly more than twice as large as we would expected for a primate brain of that size. This estimate takes into account the scaling effects of the pre-frontal cortex with neocortex size found across primates, and was calculated with human values included. It is also apparently based on surface area measurements (see Passingham 1973 p. 346). Since larger mammalian brains tend to have a greater degree of cortical folding (see below), one would expect this to be a conservative estimate of the actual difference between humans and other primates. Since our neocortex is, by itself, 3.2 times as large given our body size as one would predict on the basis of primate neocortex-to-body size scaling (Passingham 1975), our prefrontal region would appear to be more than 6 times larger than expected given a primate of our body weight.
Interestingly, it also appears that some of this increase predated hominid neuroanatomical evolution. Using Brodmann's (1912) data, we can calculate that chimpanzees have 44% more prefrontal cortex than one would expect for a primate with a chimp-sized neocortex. This suggests that the common ancestor of chimpanzees and humans had already emphasized the prefrontal cortex.
Deacon (1984, 1988) calculated that Brodmann areas 41 and 41/42 (primary auditory areas) are about 27% larger than expected given overall brain size (again using primates as a baseline). In contrast, area 4 (primary motor cortex) is only 35% as large, area 17 (primary visual cortex, also known as striate cortex) is only 60% as large (see also Holloway 1992), and area 6 (pre-motor area) is only 77% as large as would be expected based on primate brain size trends. Passingham (1975) and Deacon (1988) suggest that the human striate (primary visual) cortex scales approximately with body size. In fact, Stephan et al.'s (1981) data show that it is 31% larger than expected given our body size. Thus, even though there has been a relative decrease in the proportion of cortex that is primary visual in relation to brain size, there has been a relative increase in relation to body size (as well as a large increase in absolute terms). This will become important when we assess Holloway's argument that there was a 'reorganization' in the cortex during human evolution centered on this area (see below). The only other cortical areas for which we have significant comparative information are the superior temporal region, along with association areas around the temporal-parietal junction (including, presumably, Wernicke's area). According to Deacon (1988) these areas scale approximately with brain size.
2.3.3 Sub-Cortical Areas
As pointed out above, Deacon (1984, 1988) showed that sub-cortical areas increased relative to body size, but not with respect to brain size. As tables 2.2 and 2.3 show, many subcortical nuclei scale significantly below what we would expect for a non-human anthropoid brain of our size. Examples include the striatum (globis pallidus, putamen, and caudate nucleus) which is only .65 as large as predicted, the diencephalic nuclei (including the thalamus) which are only .70 as large, and the medulla which is only .58 as large.
Armstrong (1982) and Deacon (1984) have both analyzed various thalamic nuclei and found that some scale above brain size, in particular the lateral dorsal nucleus (LD) and the anterior principal nucleus (AP). Armstrong (1982) reports that these nuclei also are larger than expected given an ape thalamus of human size (i.e., they are not only bigger with respect to overall brain size). LD has reciprocal connections with the cingulate gyrus (part of the limbic system) and association areas of the parietal cortex (Carpenter and Sutin 1983). AP sends efferents to the cingulate gyrus, hippocampal subiculum (also part of the limbic system) and parts of the orbital frontal cortex, while receiving input from the mammilary nuclei, hippocampal subiculum (Armstrong 1982). These connections suggest that these nuclei play a role in mediating between emotional and higher cortical functions (Armstrong 1982). Armstronget al. (1987) report that the relative number of neurons in AP (with respect to brain size) is significantly correlated with social organization in a sample of primates (N=17 species), with higher relative numbers being associated with single-male (monogamous or harem) social groups, and lower relative numbers being associated with multi-male (dominance-stratified or fission-fusion) social groups.
The dorso-medial thalamic nucleus (DM), which is the main thalamic connection with the prefrontal cortex, is not particularly large with respect to the brain as a whole. It is not clear what significance this has in light of the relative expansion of the prefrontal cortex discussed above. Possibly the importance of the prefrontal cortex lies in its oversight of other cortical regions (which may not require a particularly large thalamic involvement). DM also receives input from the amygdaloid complex (part of the limbic system), and appears to be involved in the integration of somatic and visceral impulses. Connections with the prefrontal cortex therefore may affect or induce moods and other emotional states of an individual (Carpenter and Sutin 1983). Size may well be (and probably is) irrelevant in the case of processing emotional states. Size would seem to influence complexity, but it is not at all clear that complex processing is required for emotional states.
2.3.4 Spinal cord
MacLarnon (1996) showed that in mammals the weight of the spinal cord is very strongly predicted by the overall body weight (n=34, r= 0.99). Humans have almost exactly the size spinal cord that these data lead us to expect for a mammal with our body size. Of course, given that our overall brain size is much larger than predicted by body weight, our spinal cord is therefore small in relation to our brain size.
2.3.5 Gray vs. White matter
In every region of the vertebrate brain, tissues can be categorized into either gray or white matter. These areas are easy to distinguish by gross inspection and also represent different functional types of tissue: Gray matter contains mostly neuron cell bodies, while white matter contains mostly axons of these cell bodies (axons are connective fibers between neurons in different brain regions). Buxhoeveden and Armstrong (1991) report that humans have a larger proportion of white matter in relation to brain size than rhesus monkeys. Deacon (1990), however, has argued that these differences are simple scaling effects of increasing brain size, and (in effect) explain nothing that brain size doesn't already explain. There are several comparative data sets which would appear to support this contention.
Hofman (1985) compiled data from different sources in the literature on measures of both gray matter and white matter volumes in the cerebral cortex of 27 different mammals from 7 orders. In this data set, cortical white matter accounts for 35% of total brain size in the human data compared to only 21% of the total brain size in Macaca mulata (rhesus monkey). However, there is a very strong positive relationship across mammals between increasing cortex size and the percentage of cortex that is white matter (Ringo 1991). Figure 2.4 below illustrates this relationship. Increasing cortical volume in mammals appears to involve disproportionately larger amounts of white matter (r 2= 0.91). It is also quite apparent that humans are not particularly unusual with respect to the percentage of cortical white matter, given the size of our cortex. A number of other mammals in this data set lie farther above the least-squares regression than do humans. Figure 2.5 plots cerebral gray matter volumes against cerebral white matter
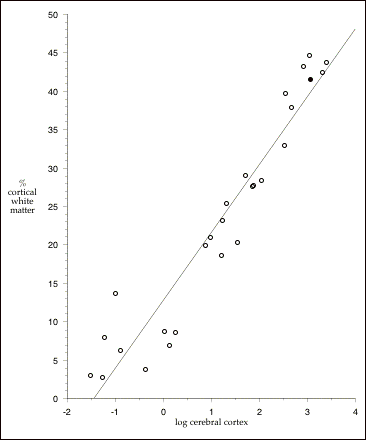
Figure 2.4: The relationship between volume and percent white matter in the cerebral cortex of mammals. Filled circle (¥) is Homo sapiens. Least-squares regression (excluding human data): % white matter = 12.758 + 8.768 x log cerebral cortex (cm3); r2 = .91. Data from Hofman (1985); includes all species with data on gray and white matter volumes (8 insectivores, 7 primates, 2 carnivores, one rodentia, 4 ungulates, 4 cetaceans, and one proboscidean; total n =27).
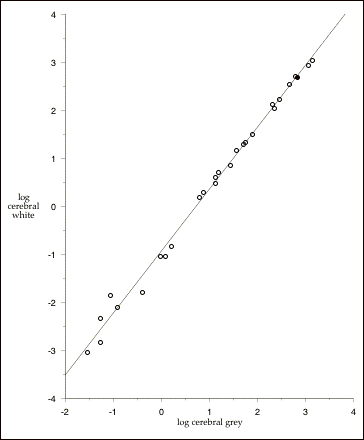
Figure 2.5: The non-isometric relationship between gray and white matter cerebral volumes in mammals. Least-squares regression (excluding human data): log cerebral white (cm3) = -.942 + 1.292 x log cerebral gray (cm3);r2 = .99. The slope of this line is significantly greater than 1, indicating that cerebral white matter increases faster than cerebral grey. Filled circle (¥) is Homo sapiens. Data from Hofman (1985); includes all species with data on gray and white matter volumes (8 insectivores, 7 primates, 2 carnivores, one rodentia, 4 ungulates, 4 cetaceans, and one proboscidean; total n =27).
volumes for the same sample of species. The relationship is extremely tight, and humans fall essentially right on the line. That is, we have almost exactly as much white matter in our cerebral cortices as we would expect given the amount of gray matter in our cerebral cortices.
Nevertheless, there is an interesting implication hidden in the specifics of the relationship between brain size and the percentage of cortical white matter that deserves attention. Ringo (1991) notes that if individual neurons are to maintain the same "percent connectedness" (i.e., be connected to the same percentage of other neurons in the brain) in the face of increasing numbers of neurons, the number of interconnections required will increase much faster than the number of neurons. For example, two neurons require only two connections (one from each neuron) to be fully interconnected, while four neurons require 12 connections (three from each neuron). Ringo (1991) notes that the actual slope of the relationship between increasing cortex size and percentage white matter in mammals (as seen in figure 2.4) is significantly less than would be necessary to maintain percent-connectedness. Ringo's (1991) model suggests that this is because performance gains in increased computing power are increasingly offset by the escalating costs of maintaining the same degree of interconnectedness.
Regardless of the explanation, however, increasing brain size goes hand in hand with decreasing average percent-connectedness of neurons. This can be generalized to cortical columns (the basic functional grouping of neurons in the cortex, in which neurons in a given column appear to function more or less as a single processing unit; see Eccles 1989, Carpenter and Sutin 1983), which suggests that one of the consequences of increasing absolute brain size is increasing specialization of the cortex (and other parts of the brain). This would be consistent with Rensch's (1956) argument that absolute differences in brain size (not just relative differences) have important behavioral consequences (see discussion below).
As Ringo 1991) points out, the idea of increasing specialization as a consequence of simple increases in brain size is consistent with the following comparative findings: 1) rats have small, unspecialized, "equipotential" cortices (Lashley 1950, Meyer 1984) while monkeys have large, very specialized cortices (e.g., Maunsell and Newsome 1987), 2) the visual cortex in cats is more strongly influenced by non-visual input (Spinelli et al. 1968; Fishman and Michael 1973) than appears to be the case for monkeys (see Ringo 1991 for reference). To these examples we should add the fact that the degree of functional separation of cortical areas varies tremendously from primitive to more complex mammals (Uylings and Van Eden 1990, Ebbesson 1984). For example, the somatosensory (primary sensory) and motor areas of the cortex completely overlap in the opossum, overlap only in areas devoted to the hind limbs in rats, and are completely separate in primates (Ebbesson 1984). Commissural connections (i.e., fibers connecting similar regions of the left and right cortex) are found to all areas of the opossum cortex, whereas large areas lack such connections in primary visual, auditory and somatosensory cortices of carnivores and primates (Ebbesson 1984). In general, it would appear that the evolution of new circuitry involves the loss of connections present in the primitive condition, not the addition of connections previously lacking (Ebbesson 1984).
Another data set which confirms this general idea comes from comparative analyses of corpus callosum cross-sectional area. It turns out that there are very strong relationships between brain size and corpus callosum cross-sectional area within a number of different mammalian orders (figure 2.6). The human data are almost exactly predicted by the non-

human primate data. Thus, humans would
appear to have corpus callosa which are as large in cross-sectional
area as we would expect given our brain size, even though our corpus
callosa have greater cross-sectional area overall than other primates. The fact that the slope of the line relating
brain size to corpus callosum size is greater than 1 in primates and
cetaceans (although not insectivores) is consistent with the idea of
increasing specialization with increasing brain size (slopes greater
than 1 indicate that brain size is increasing at a faster relative rate
than corpus callosum cross-sectional area). This
can also be seen in figure 2.5, in which the slope of the relationship
between cerebral grey and cerebral white matter is also significantly
greater than 1, indicating that cerebral white matter increases faster
than cerebral grey matter.
It of course remains possible that either gray or white matter might be more important for certain cognitive tasks. Even if the relative proportions of gray and white matter are mostly a function of brain size between species, selection might be operating primarily upon one of these tissue types, leading to more rapid evolutionary change in that tissue. Change in the other tissue would then lag behind in the short term.
2.3.6 Cortical folding
The human brain has a high degree of cortical folding (Jerison 1982, Ziles 1988, Armstrong 1991). However, Jerison (1982) pointed out that cortical surface area across mammals increases at almost an isometric rate with brain size increases. This is not an obvious result: Simple increases in the volume of an object (e.g., a sphere) have the effect of increasing the surface area of the object by only a power of .67 if the shape is held constant. Thus, as brain size increases in mammals, cortical surface area increases at a faster rate than the minimum necessary to enclose the brain. In order to accomplish this, increased cortical folding with increasing brain size would appear a necessary consequence. Jerison (1982) showed that the cortical surface area and average length of gyri in humans were entirely predictable given our brain size and the general mammalian relationships for these variables. He did allow that differences between hemispheres or regions of the cortex in the degree of cortical folding might indicate some sort of functional reorganization (see below). Armstronget al. (1991) subsequently showed that the human pattern of cortical folding is different from both pongids and cercopithecines. Their method was to calculate the ratio of total contour (including gyri and sulci) to the external contour (ignoring sulci) on each of 40 equally spaced coronal slices across the brain (rostral to caudal), and then to plot these ratios on a single graph. Cercopithecines display lower ratios across the board compared to humans and pongids, and have a single peak in the size of the ratio about 75% of the way back (moving rostro-caudally). In comparison to pongids, humans have relatively more folding in the rostral portions of the brain, but completely overlap in the caudal 65%. This is consistent with Deacon's (1988) finding that the pre-frontal (especially) and the parietal regions are larger in humans than we would expect even given our brain size (see above).
2.3.7 Functional Reorganization
One of the fundamental issues in human neuroanatomical evolution is the extent to which the changes that occurred are explained by simple increases in brain size. Holloway has long argued that functional reorganization occurred early in hominid evolution, in some important cases before any significant changes in brain size. With respect to human neurological and behavioral evolution, he sees reorganization to be at least as important as overall increases in brain size (see, e.g., 1995a). The use of the term 'reorganization' may be somewhat misleading because he doesn't actually mean, for example, that functions that used to occur in one area now occur in another. He has defined reorganization as the "...shifting quantitative relationships of subsystems and components of the nervous system," (Holloway, 1966, p. 305). He has also suggested that simple relative increases in brain size constitute evidence for reorganization (e.g., Holloway and de la Coste-Lareymondie 1982, p. 108), which makes the term so inclusive that it is hard to disagree with his assessment that reorganization was crucial to hominid brain evolution. More recently (Holloway 1995b), he has discussed four ways in which reorganization could occur:
"In the first case, called A, you can have brain size increase without any change between the size of the components or the connections between them. This change could occur isometrically or allometrically. The second case, B, does not involve any change in absolute brain size. This is the situation in which changes somewhere in the genome, or in a regulatory gene, will limit the development of one region and induce some hyperplasia in the other...Hypothesis C is more difficult and it is called a hierarchical or mutational change. The fibre systems are maturating at different rates and/or increasing in number between the different cortical regions through the corpus callosum...Finally, in case D we now have asymmetries and no change in overall brain size. (p. 57-58)
In all of these cases, the hypothesized reorganization involves at most changes in the quantitative relationships between functional areas, and not some form of structural or functional rearrangement. Some connections augmented and strengthened, while others were left unmodified, the overall result being a qualitative (and often important) change.
It is crucial to keep in mind that there is a tremendous amount of similarity across mammals in basic brain structure and organization. Deacon (1992) notes that "...the underlying connectional relationshipsÐthe functionally significant neural architectureÐare highly conservative across mammalian brains, with no clear cases of accretion of new structures or invasion of novel targets by existing axons" (p. 53). Deacon's own work has shown that the same basic neuroanatomical connections to Broca's area that have been hypothesized to exist in humans (through studying the behavioral effects of brain damage, electrical stimulation of various brain regions in awake patients undergoing neurosurgery, etc.) also exist for the homologue of Broca's area in Macaca fasicularis (Deacon 1984). Deacon (1992) summarizes the situation in the following manner: "The human brain clearly has not been enlarged in some generalized way, nor have novel functional areas or new circuit [sic] been inserted into the brain" (p. 64).
The question of reorganization has been addressed in two ways. First, the comparative method, as outlined in previous sections, can be used to compare different aspects of the modern human brain with the same aspects of the brains of modern pongids. Differences in the relative proportions of various aspects of the brain are evidence for reorganization (as Holloway defines it). The second way in which reorganization has been studied is through the analysis of the few fossil brain endocasts that are available. Various surface features of the brain (sulci and gyri) sometimes appear on the surface of the endocasts, and since some (but not all) sulci often mark the boundaries of different functional regions, it is possible, at least in theory, to estimate in a rough way the size of different functional regions in fossil species.
Unfortunately, the work on fossil endocasts is complicated by the fact that, as Holloway (1981a) pointed out, "...direct visual observations of convolutional relief patterns on endocasts are difficult to substantiate (LeGros Clark et al. 1947, Hirschler 1942, Symington 1916, Connolly 1950, von Bonin 1963, Holloway 1978, to mention but a few)," (p. 43). Since it is difficult to match up surface details on endocasts to the sulci of the brains of species we actually have available, it is surely more difficult to be confident of the surface details of fossil endocasts. In the studies reviewed below it is important to keep in mind that comparative measurements of the locations of various sulci were done only on actual chimpanzee brains, with comparisons then made to fossil endocasts.
The sections below review the evidence and controversies surrounding the fossil evidence for functional reorganization. Holloway (1995a) suggests three major reorganizational changes in human neuroanatomical evolution. First, he believes that between 3 and 4 million years ago there was a reduction in the primary visual cortex (Brodmann area 17) with a corresponding enlargement of extrastriate parietal cortex (Brodmann areas 18 and 19), angular gyrus (Brodmann area 39), and the supramarginal gyrus (Brodmann area 40) of the inferior parietal cortex. Second, he believes that between 2.5 and 1.8 million years ago a reorganization occurred in the frontal lobe, "...mainly involving the third inferior frontal convolution, known as Broca's area..." (p. 42). Finally, he argues that perhaps 2 to 3 million years ago there was a reorganization involving the development of cerebral asymmetries resulting in right frontal petalia (in which the right frontal lobe projects more anteriorly and is wider than the left frontal lobe) and left occipital petalia (in which the left occipital lobe projects more posteriorly and is wider than the right occipital lobe).
2.3.7.1 Primary Visual Cortex and The Lunate Sulcus
The portion of the cortex that has received the greatest amount of attention is the primary visual area in the occipital region of the brain. Holloway and Falk have engaged in a lengthy debate over the positioning of the lunate sulcus on endocasts attributed to both Australopithecus africanus (Taung) and Australopithecus afarensis (AL 162-28) (Holloway 1981a, 1983, 1984, 1985, 1991, 1992, 1995a; Holloway and Kimbel 1986, Falk 1980, 1983b, 1985a, 1985b, 1986, 1991; Falk, et al. 1989) The lunate sulcus, which is roughly oriented vertically on the occipital lobe, appears to mark the anterior boundary of the primary visual cortex in non-human primates, and is often missing in humans [Connolly (1950) reports that a continuous lunate was present in only 58% of 120 human brains]. In relative terms, an anterior (rostral) position is characteristic of the general pongid condition, whereas a posterior (caudal) placement is characteristic of modern humans.
Originally, Falk (1980) argued that sulcal patterns on the early australopithecine endocasts (of which there were only seven available to her at the time) did not show features differentiating them from modern apes. Though she argued that the lunate was not clearly present on the Taung endocast, she did suggest a possible position for it that was relatively anterior. Holloway (1981a) contested most of her assertions, in particular that the lunate could be seen at all, or that it might be in an anterior position. He argued that: "We cannot prove where the lunate sulcus is located, only demonstrate where it is not," (p. 49, original emphasis). This would appear to contradict his earlier suggestion (Holloway 1975) that "Although only a few hominid endocasts (particularly the original Taung (1924) endocast) show the sulcus clearly, it is definitely in a posterior, human-like position," (p. 11).
In any case, in the long series of exchanges with Falk following his 1981a paper, Holloway has attempted to show via various comparative methods that the lunate could not reasonably be where Falk (1980) suggested that it might have been. Falk has repeatedly challenged his conclusions (see references above). However, it would appear that if the lunate is where Falk suggests it might be, it is fairly anterior even compared to modern chimps. Holloway (1988) showed that the ratios of (occipital pole-to-lunate sulcus) divided by (occipital pole-to-frontal pole) (OP-LS)/(OP-FP) for a sample of 32 chimpanzee brain hemispheres averaged more than 2 standard deviations posterior to the location he believes Falk (1980) identified as the probable location of the lunate on the Taung endocast. Falk (1989) disputes his measurements and points out that her published (Falk 1985a) values for the (OP-LS)/(OP-FP) ratio for Taung suggest that it is only 1.5 standard deviations from Holloway's mean chimpanzee value. Furthermore, she contends that a juvenile chimpanzee brain in her collection yields a ratio that is much more anterior than her estimate for Taung, suggesting that, if the location of the lunate on this endocast is correct, Taung would fit comfortably in the range of modern chimps for this characteristic. Holloway (1991) disputes this claim (see below) and notes that their difference in ratios stems from a 2 mm difference in their respective estimates of OP-LS length for Taung.
Holloway and others (Holloway 1983, 1991, Holloway and Kimbel 1986, Holloway and Shapiro 1992) have provided additional support for his argument of functional reorganization through an analysis of the Australopithecus afarensis specimen from Hadar, Ethiopia: AL 162-28. While the endocast includes only the posterior portion of the brain and does not have a clear lunate, it does have a definable intraparietal (IP) sulcus. IP runs roughly horizontally, dividing the superior and inferior parietal lobules (Holloway 1983, Holloway and Shapiro 1992), and ends posteriorly on (or very close to) the vertically oriented lunate sulcus. This suggests that the most anterior position of the lunate that is possible on AL 162-28 is the posterior end of the IP. Holloway and colleagues have shown that the distance from the occipital pole to IP in a sample of 19 chimpanzee brains averages 31.2 mm (with a standard deviation of ~3 mm), while the same distance on AL 162-28 is only 15-16 mm (i.e., about 5 standard deviations from the chimpanzee mean; see Holloway 1995a). This suggests that the lunate sulcus was more posteriorly positioned (as in modern humans) in this specimen. Falk (1985b) agrees that the feature Holloway and colleagues have called IP is in fact IP, but disagrees with the orientation of the endocast (see also Falk 1989, 1991). Her orientation differs from that used by Holloway and colleagues (Kimbel et al. 1982) by close to 40 degrees (Holloway and Shapiro 1992). There is also some disagreement about exactly where the feature she is labeling lunate is located on AL 162-28, such that her measurements and those of others (including Boaz 1988) differ by about 3 mm. Holloway and Shapiro (1992) showed that Falk's (1985b) orientation of the fragment places what appears to be an imprint of a portion of the squamosal suture inferior to what appears to be an imprint of asterion. This is an unusual situation in the samples of chimpanzee species measured by Holloway and Shapiro (1992). Falk (1986) denied that one could be so sure of the location of the squamosal suture or asterion on this fragment.
There are several important points to make about these controversies. First, Holloway clearly does not agree with Falk's measurement techniques (Holloway 1991), even when she apparently replicates his own methodology (e.g., see Falk 1985a). Because of this, he apparently feels justified in ignoring her own measurements of Taung and of a juvenile chimpanzee brain in her collection. The personal nature of these arguments (on both sides) makes it very difficult for others to objectively assess the evidence one way or the other. Secondly, on both specimens, Taung and AL 162-28, the differences in measurement between Falk and Holloway and colleagues are very small (2 mm for Taung and 3 mm for AL 162-28). If so much is at stake on the basis of such little differences, one might legitimately ask whether too much is being asked of the available evidence. Thirdly, we are only dealing with two specimens. Granted, they are the only two which may show anything at all, but this fact simply does not justify broad sweeping generalizations about entire fossil species. It is hard not to agree with Boaz (1988) when he writes: "With this degree of doubt regarding the structure in question [the lunate sulcus on AL 162-28], debate over its position seems unprofitable and should await the recovery of more fully preserved specimens," (p. 96, also cited in Falk 1991).
Another important question involves the extent to which age plays a role in the relative position of the lunate. Falk (1985a, 1989) notes that her chimpanzee brain with very anteriorly placed lunate sulci is a juvenile specimen. Taung, of course, was also a juvenile (about three or four years of age at death, Bromage and Dean 1985). Unfortunately, we have no idea how many of Holloway's sample are juvenile, let alone whether they differ on average from the adult specimens. Holloway's (1991) response to this general question is simply that his sample, "...includes young juveniles as well as adults," (p. 87). This, as Holloway must know, is not productively addressing the issue.
An even more crucial issue, however, is the fact that Holloway's argument requires that relative proportions of neural tissue are the functionally important factor, not absolute amounts. This fact, though implicit, has implications which have been ignored to date in the discussions on this issue. It turns out that modern humans have, in absolute terms, more than 1.5 times as much primary visual cortex as either chimpanzees or gorillas (Stephan et al. 1981) even though this is a smaller proportion of our overall brain size than is found in these apes. Interestingly, Holloway (1992) never mentions this fact in his analysis of Stephan et al.'s (1981) data, and instead focuses on the differences in relative proportions, even though it is not at all clear what the primary visual cortex should be scaled with, at least with respect to functional ability.
For example, one could reasonably argue that functional ability with respect to the size of the primary visual cortex should be judged relative to the size of the retina, not the overall size of the brain (Deacon 1990c). On these grounds, we should expect humans to have better (i.e., more complex, greater useful division of the color spectrum, etc.) vision than chimpanzees or gorillas. If this assumption is correct, then absolute differences in the size of the primary visual cortex would be the crucial issue. If we assume that human visual ability is not significantly different than pongids, and if ability is related to absolute and not relative primary visual cortex size, then the real question would be, "Shouldn't the human primary visual cortex be even smaller than it is?" and not "Why is the human primary visual cortex as small as it is?" In fact, because of the unique differences between human and pongid brains, it may be possible to address the question of whether absolute size or relative size of the primary visual cortex is more important functionally. If absolute size is more important, one should be able to demonstrate superior visual abilities of some kind in humans, since we have significantly greater absolute amounts of primary visual cortex. Conversely, if relative proportions are more important functionally, pongids should show superior visual abilities, since they have significantly greater relative amounts of primary visual cortex. As far as I am aware, no experiments designed to test these questions have been done.
The same general issue of whether relative or absolute differences in cortical tissue are more important functionally arises in reverse with respect to the early australopithecines. If there truly was a reduction in the relative size of the primary visual cortex in these early hominids, as Holloway argues, they must therefore also have had significantly less primary visual cortex in absolute terms. (It is true that australopithecines may have had relatively larger brains with respect to body weight, but this is because they apparently weighed less overall, not because they had absolutely larger brains; see above and Holloway 1976, 1981a, McHenry 1975, 1992)
For the relative difference in the size of the primary visual cortex to be the relevant functional factor, which is Holloway's argument, we have to assume that the early australopithecines had functionally equivalent vision to modern humans. However, we are then left asking why any size increase would ever occur in any hominid (or any other evolutionary lineage). Given the evolutionary costs of maintaining larger brains (see below) why don't modern humans simply have the same relative proportions of different neural components as we have today, but with brains the same size of modern chimps (or rats, for that matter)? Holloway might argue that increases in volume of neural tissue are unrelated to functional ability in specific domains (e.g., vision), but not others (e.g., general intelligence). However, this would clearly be post-hoc, and would certainly not be the most parsimonious explanation. In any case, whether or not visual ability is affected by absolute or relative size of the primary visual cortex, we are left with the suggestion that vision simply was not as important to early hominids as it is to modern pongids. I do not think, a priori, that this is a reasonable assumption.
For these reasons, I would argue that the relative decrease in primary visual cortex most likely occurred after significant increases in absolute brain size had already begun. The simplest way to increase brain size is probably through some form of lengthened growth trajectory. This would tend to increase different portions of the cortex in a simple allometric fashion (with different areas increasing at different allometric rates). If functional ability of the primary visual cortex is related to the relative size of the retina, and not the relative size of the overall brain, then the relative decrease in the size of primary visual cortex could be explained as a result of selection against excess cortical tissue (for reasons outlined below). There may not have been a selective advantage for better visual abilities during hominid evolution, since primates in general have very good vision with respect to other animals to begin with. It might well be difficult (in a genetic developmental sense) to completely separate growth in one cortical region from growth in another. This would lead to a compromise between a relative decrease coupled with an absolute increase in the primary visual cortex. In any case, because Holloway's argument requires such a peculiar set of assumptions about functional ability with respect to size, I would suggest that it is a priori very unlikely. The burden of proof should rest with those who believe that relative changes in cortical size occurred in hominid evolution before any significant change in brain size.
2.3.7.2 Inferior Frontal Lobe
In contrast to the controversy surrounding the lunate sulcus, both Falk (1983a) and Holloway (1995a) appear to agree that the orbitofrontal cortex of the left hemisphere of Homo habilis appears more like modern humans than like modern pongids. This conclusion is based on analysis of a specimen from Kenya: KNM-ER 1470, which is about 1.8 million years old. According to Falk (1983a), two marks on an endocast of this specimen appear to be oriented and positioned similarly to the sulci which mark the anterior and posterior borders of pars triangularis (Brodmann area 45) in modern humans. This area, along with cortex immediately caudal to it, form Broca's area. KNM-ER 1470 differs from modern humans in the distance between these two apparent sulci, suggesting that this area was not as fully developed in this specimen. Nevertheless, Falk (1983a) believes that if this were an endocast of a modern human skull rather than from KNM-ER 1470, "...one would conclude that the external gross morphology near and partially in Broca's area appeared normal and that the human in question had probably been capable of speech..." (p. 1073). Falk also notes that this specimen lacks a fronto-orbital sulcus, which is found in all modern pongids and (according to Falk 1980) all South African australopithecines. In modern humans the lateral frontal lobe is more convoluted and expanded, such that the fronto-orbital sulcus is buried (becoming the anterior boundary of the insula) and is not visible on endocasts (Falk 1983a, Connolly 1950). This specimen had an estimated cranial capacity of 752 cm3 (Holloway 1978), which is significantly larger than any australopithecine. This change in the orbitofrontal region was therefore accompanied by, or was part of, a general increase in brain size that occurred between the early australopithecines and early Homo.
It is important to note that another putative Homo habilis specimen, KNM-ER 1805, dated to between 1.26 and 1.8 million years old, was also studied by Falk (1983a). She found no evidence of the sulci that form the border of pars triangularis, but did find evidence of an apparent fronto-orbital sulcus (found in modern pongids but not modern humans), suggesting that not all Homo habilis were human-like in this cortical region (it is possible that this specimen is an australopithecine, however). It is significant to note that this specimen has a cranial capacity of only 582 cm3 (Holloway 1978). Thus, it would appear that, with respect to this particular cortical region, modern human sulcal patterns co-occur with significant increases in cranial capacity.
2.3.7.3 Cortical Asymmetry
The third aspect of neuroanatomical reorganization suggested by Holloway involves cortical asymmetries characterized by right-frontal and left-occipital petalias. Holloway and de la Coste-Lareymondie (1982) studied 190 hominoid endocasts and found that only modern and fossil hominids (including australopithecines, Homo erectus , and Neanderthals) showed a consistent, distinct right-frontal and left-occipital petalial pattern. Their sample included 40 gorilla (Gorilla gorilla), 41 pygmy chimpanzee (Pan paniscus), 34 common chimpanzee (Pan troglodytes), 20 orangutan (Pongo pygmaeus), and 14 modern human endocasts. Their pongid samples did show petalias, but they did not display the same degree of consistency, particularly in the combination of right-frontal and left-occipital petalias. Only 25% of the 135 pongids displayed this pattern, compared to 82% of the 38 hominids. Falket al. (1990) demonstrated that Rhesus monkeys (Macaca mulatta) show a significant tendency towards right-frontal petalia (though not to the same consistency as is found in modern and fossil hominids) but not for left occipital petalia (total n= 403). Thus it would appear that petalias in general are common in anthropoids, but the particular pattern of petalias and the degree of consistency would appear to be unique to hominids.
However, because the hominid pattern occurs in a fair number of pongid specimens, the functional significance of this finding is not clear. Holloway and de la Coste-Lareymondie (1982) speculate that this pattern may be related to right-handedness, language-related symbol manipulation and spatio-visual integration.
2.4 Summary
The most dramatic neuroanatomical change that occurred during human evolution was in overall volume. This was not due to body size changes, though presumably increased body size helps a species achieve a larger brain size. However, our brain is not a simple scaled-up version of a pongid brain. Of the various important neuroanatomical components, the telencephalon (and more specifically the neocortex) has undergone the greatest degree of change relative to body size. All other major components have not kept pace with the change in neocortex, and some scale closely with our overall body size (principally the spinal cord and medulla). Most other important components scale significantly above body size, but below brain size. Within the neocortex, the prefrontal region, which is twice as large as expected given a primate brain of our size, has shown by far the greatest increase. This no doubt has tremendous implications, which will be discussed further below. It is also important to note that some of these changes (e.g., the disproportionate size of the prefrontal cortex) may well have started prior to the hominid-pongid divergence.
Some interesting features that distinguish human brains from other species (pongids in particular) appear to be simple correlates of the increase in size. Such features include the amount and proportion of white matter with respect to gray matter, the degree of cortical folding, and most likely the extent of cortical specialization. The fact that these differences can be explained as correlated responses to increased brain size does not mean that they have no important behavioral implications, however. The degree of cortical specialization, even if predictable, has no doubt had a profound impact on human behavioral evolution. The development of cortical language areas are one result of the general process made possible by massive increases in overall brain size.
The "reorganization" of the hominid brain during evolution refers simply to relative differences in the proportions (and presumably their behavioral importance) of different components of the brain. There is no unequivocal evidence that such reorganization occurred prior to the increase in overall brain size, though the available fossil evidence cannot rule it out. Clearly, important changes occurred during the evolution of our brains, but many would appear to be associated with the increase in brain size, which made cortical specialization easier, and even likely.